Weekend Sale - 70% Discount Offer - Ends in 0d 00h 00m 00s - Coupon code: dm70dm

Analytics-Con-301 Salesforce Certified Tableau Consultant Questions and Answers

Questions 4

A Tableau Cloud client has requested a custom dashboard to help track which data sources are used most frequently in dashboards across their site.

Which two actions should the client use to access the necessary metadata? Choose two.

Options:

A.

Connect directly to the Site Content data source within the Admin Insights project.

B.

Query metadata through the GraphiQL engine.

C.

Access metadata through the Metadata API.

D.

Download metadata through Tableau Catalog.

Buy Now
Questions 5

From the desktop, open the CC workbook. Use the US Population Estimates data source.

You need to shape the data in US Population Estimates by using Tableau Desktop. The data must be formatted as shown in the following table.

Analytics-Con-301 Question 5

Open the Population worksheet. Enter the total number of records contained in the data set into the Total Records parameter.

From the File menu in Tableau Desktop, click Save.

Options:

Buy Now
Questions 6

Use the following login credentials to sign in

to the virtual machine:

Username: Admin

Password:

The following information is for technical

support purposes only:

Lab Instance: 40201223

To access Tableau Help, you can open the

Help.pdf file on the desktop.

Analytics-Con-301 Question 6

From the desktop, open the CC workbook.

Open the Categorical Sales worksheet.

You need to use table calculations to

compute the following:

. For each category and year, calculate

the average sales by segment.

. Create another calculation to

compute the year-over-year

percentage change of the average

sales by category calculation. Replace

the original measure with the year-

over-year percentage change in the

crosstab.

From the File menu in Tableau Desktop, click

Save.

Options:

Buy Now
Questions 7

From the desktop, open the CC workbook.

Open the Manufacturers worksheet.

The Manufacturers worksheet is used to

analyze the quantity of items contributed by

each manufacturer.

You need to modify the Percent

Contribution calculated field to use a Level

of Detail (LOD) expression that calculates

the percentage contribution of each

manufacturer to the total quantity.

Enter the percentage for Newell to the

nearest hundredth of a percent into the

Newell % Contribution parameter.

From the File menu in Tableau Desktop, click

Save.

Options:

Buy Now
Questions 8

From the desktop, open the CC workbook.

Open the Incremental worksheet.

You need to add a line to the chart that

shows the cumulative percentage of sales

contributed by each product to the

incremental sales.

From the File menu in Tableau Desktop, click

Save.

Options:

Buy Now
Questions 9

From the desktop, open the CC workbook.

Open the City Pareto worksheet.

You need to complete the Pareto chart to show the percentage of sales compared to the percentage of cities. The chart must show references lines to visualize how the data compares to the Pareto principle.

From the File menu in Tableau Desktop, click Save.

Options:

Buy Now
Questions 10

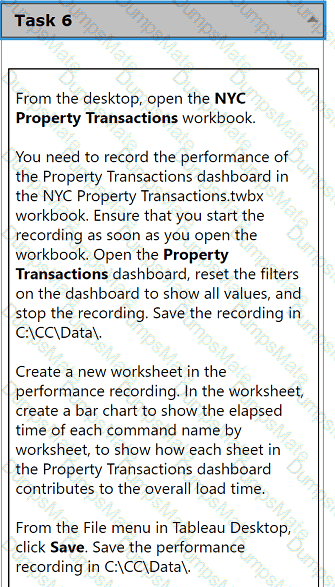
Analytics-Con-301 Question 10

From the desktop, open the NYC

Property Transactions workbook.

You need to record the performance of

the Property Transactions dashboard in

the NYC Property Transactions.twbx

workbook. Ensure that you start the

recording as soon as you open the

workbook. Open the Property

Transactions dashboard, reset the filters

on the dashboard to show all values, and

stop the recording. Save the recording in

C:\CC\Data\.

Create a new worksheet in the

performance recording. In the worksheet,

create a bar chart to show the elapsed

time of each command name by

worksheet, to show how each sheet in

the Property Transactions dashboard

contributes to the overall load time.

From the File menu in Tableau Desktop,

click Save. Save the performance

recording in C:\CC\Data\.

Options:

Buy Now
Questions 11

A consultant is designing a dashboard that will be consumed on desktops, tablets, and phones. The consultant needs to implement a dashboard design that

provides the best user experience across all the platforms.

Which approach should the consultant take to achieve these results?

Options:

A.

Build one dashboard that has desktop, tablet, and phone layouts, and fix the size of the layouts.

B.

Build one dashboard and fix the size of the dashboard.

C.

Build one dashboard and set the size to Automatic.

D.

Build one dashboard for each type of device and fix the size of the layouts.

Buy Now
Questions 12

A client wants to produce a visualization to show quarterly profit growth and aggregated sales totals across a number of product categories from the data

provided below.

Analytics-Con-301 Question 12

Which set of charts should the consultant use to meet the client's requirements?

Options:

A.

Line and bubble charts

B.

Waterfall chart and tree map

C.

Gantt and bar charts

D.

Scatter plot and pie chart

Buy Now
Questions 13

A client wants to count all the distinct orders placed in 2010. They have written the following calculation, but the result is incorrect.

IF YEAR([Date])=2010 THEN COUNTD ([OrderID]) END

Which calculation will produce the correct result?

Options:

A.

IF MIN(YEAR([Date]))=2010 THEN WINDOW_COUNTD([OrderID]) END

B.

IF YEAR([Date])=2010 THEN {COUNTD ([OrderID])} END

C.

COUNTD(IF YEAR([Date])=2010 THEN [OrderID] END)

D.

COUNT(IF YEAR([Date])=2010 THEN [OrderID] END)

Buy Now
Questions 14

A client wants to migrate their Tableau Server to Tableau Cloud. The Tableau Server is configured with three sites: Finance, Strategy, and Marketing. A

consultant must provide a solution that minimizes user impact and costs.

Which configuration should the consultant recommend for Tableau Cloud to meet the client's requirements?

Options:

A.

One Tableau Cloud instance configured with a Finance project folder, Strategy project folder, and Marketing project folder

B.

One Tableau Cloud instance with two sites for Strategy and Marketing, and one Tableau Server instance for Finance

C.

Three separate Tableau Cloud instances for Finance, Strategy, and Marketing

D.

One Tableau Cloud instance configured with all workbooks in a single project

Buy Now
Questions 15

A consultant plans a Tableau deployment for a client that uses Salesforce. The client wants users to automatically see Tableau views of regional sales filtered

by customer as soon as the users sign into Salesforce.

Which approach should the consultant use to deliver the final visualization?

Options:

A.

Embed views into Salesforce.

B.

Create a list of URLs that the users can click in Salesforce.

C.

Publish to Tableau Mobile for viewing.

D.

Create subscriptions for each view to deliver reports by email.

Buy Now
Questions 16

A client requests a published Tableau data source that is connected to SQL Server. The client needs to leverage the multiple tables option to create an

extract. The extract will include partial data from the SQL Server data source.

Which action will reduce the amount of data in the extract?

Options:

A.

Use an extract filter.

B.

Aggregate the extract to the visible dimensions.

C.

Define the filters by using custom SQL.

D.

Set up the extract as an incremental refresh.

Buy Now
Exam Code: Analytics-Con-301
Exam Name: Salesforce Certified Tableau Consultant
Last Update: Aug 12, 2025
Questions: 55

PDF + Testing Engine

$49.5  $164.99

Testing Engine

$37.5  $124.99
buy now Analytics-Con-301 testing engine

PDF (Q&A)

$31.5  $104.99
buy now Analytics-Con-301 pdf
dumpsmate guaranteed to pass
24/7 Customer Support

DumpsMate's team of experts is always available to respond your queries on exam preparation. Get professional answers on any topic of the certification syllabus. Our experts will thoroughly satisfy you.

Site Secure

mcafee secure

TESTED 17 Aug 2025