In Tableau, you can manage the visibility of different visualizations on a dashboard using various techniques. Among the options provided, the most straightforward method to allow users to switch between two visualizations is to use show/hide buttons.
Here ' s why each option is or isn’t suitable for the requirement:
A. A parameter and a calculated field: While it ' s possible to use a parameter and a calculated field to control which visualization is displayed, it requires creating a calculated field that responds to a parameter and then using that field to filter the view. This method can become complex and is not as user-friendly for simply showing and hiding visualizations.
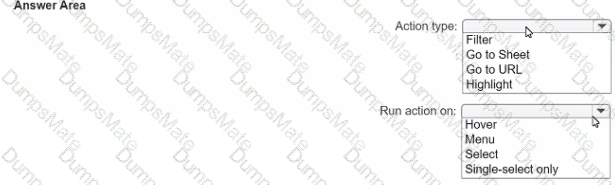
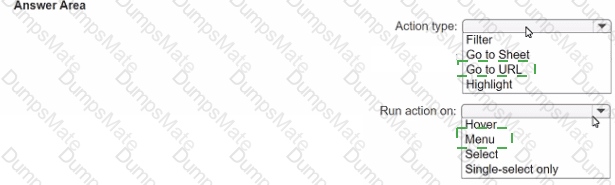
B. Worksheet actions: Worksheet actions in Tableau typically allow users to interact with the data within a visualization, such as filtering data or highlighting related data points when clicking or hovering. They are not designed to control the visibility of entire visualizations on a dashboard.
C. Show/hide buttons: Show/hide buttons are a feature specifically designed to manage the visibility of dashboard elements. When you create a show/hide button, it can be configured to display or hide a particular visualization, container, or any other dashboard element when clicked. This provides a very intuitive interface for users to switch between visualizations.
D. Dashboard actions: Dashboard actions, like worksheet actions, are used to create interactions between sheets, such as filtering data or navigating to other sheets or URLs based on user interactions. They are not intended for toggling the visibility of visualizations.
Therefore, the correct answer is C. Show/hide buttons as they provide a user-friendly way to switch between visualizations on a dashboard without the need for complex calculations or actions that aren ' t meant for this purpose. The show/hide button feature is specifically designed for toggling visibility and offers a simple and effective solution for the requirement.