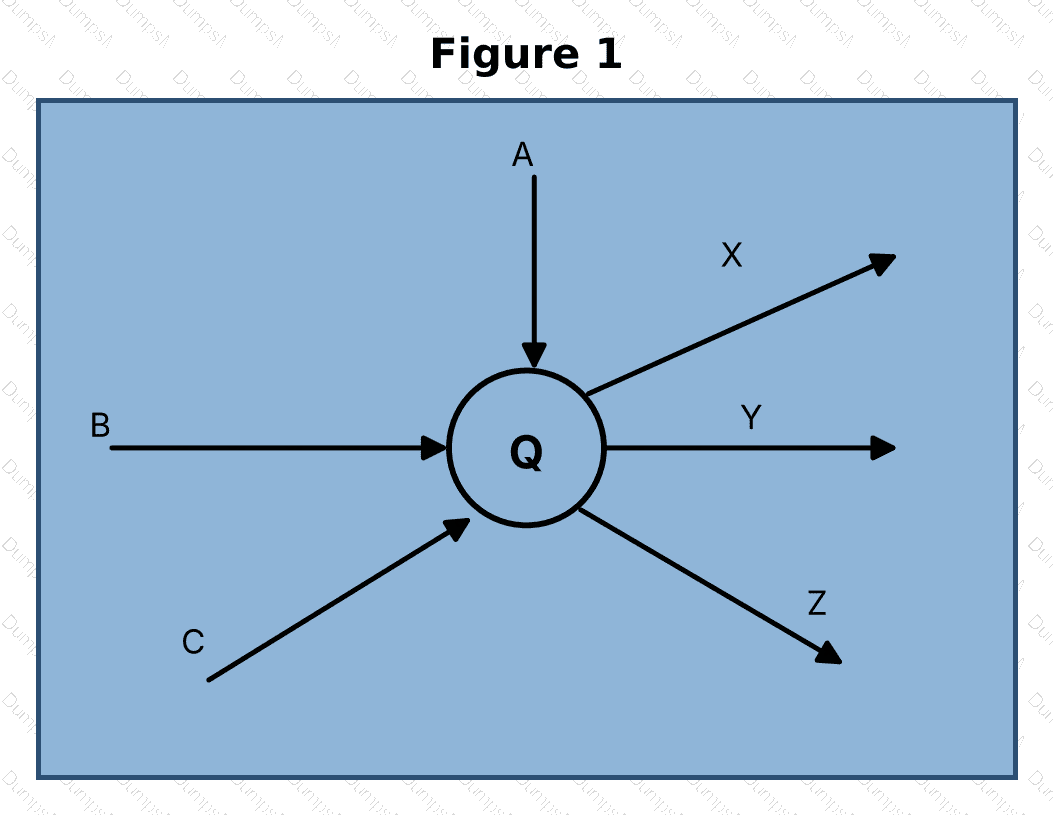
Figure 1 is a process, or system, diagram in which the circle labeled Q represents a process that transforms what enters it into what leaves it. Arrows show the direction of movement across the boundary of the process. Three arrows, labeled A, B, and C, point toward Q, indicating that they enter the process from outside; these are inputs, the data, materials, or resources the process consumes or acts upon. Three arrows, labeled X, Y, and Z, point away from Q, indicating results that the process produces; these are outputs. Letter A is drawn as an arrow entering the top of the circle, and so it represents an input, which makes option C correct. Option B is incorrect because outputs are the arrows leaving Q, namely X, Y, and Z. Option A, flow, is a general term for movement between elements and is applicable to every arrow in the diagram; it does not identify the role of A relative to the process, which the question requires. The input, process, and output model underlies many data science concepts, from extract, transform, and load pipelines to machine learning models that receive features and return predictions. Interpreting the direction of arrows is the key to reading such diagrams correctly. Reference: Data Science Fundamentals Study Guide – Data Science Concepts: Systems and Processes (Inputs, Processes and Outputs).
===============