Winter Sale - Special Limited Time 65% Discount Offer - Ends in 0d 00h 00m 00s - Coupon code: dpm65

PL-300 Microsoft Power BI Data Analyst Questions and Answers

Questions 4

You publish the dataset to powerbi.com.

For each of the following statements, select Yes if the statement is true. Otherwise, select No.

NOTE: Each correct selection is worth one point.

PL-300 Question 4

Options:

Buy Now
Questions 5

You publish the semantic model to powerbi.com.

For each of the following statements, select Yes if the statement is true. Otherwise, select No.

NOTE: Each correct selection is worth one point.

PL-300 Question 5

Options:

Buy Now
Questions 6

You need to provide a solution to provide the sales managers with the required access.

What should you include in the solution?

Options:

A.

Create a security role that has a table filter on the Sales_Manager table whereusername = UserName()

B.

Create a security role that has a table filter on the Region_Manager table wheresales_manager_id = UserPrincipalName().

C.

Create a security role that has a table filter on the Sales_Manager table wherename = UserName().

D.

Create a security role that has a table filter on the Sales_Manager table whereusername = sales_manager_id.

Buy Now
Questions 7

You need to configure access for the sales department users. The solution must me meet the security requirements. What should you do?

Options:

A.

Add the sales department as a member of the reports workspace

B.

Add the Azure Active Directory group of the sales department as an Admin of the reports workspace.

C.

Distribute an app to the users in the Azure Active Directory group of the sales department.

D.

Share each report to the Azure Active Directory group of the sales department.

Buy Now
Questions 8

You need to get data from the Microsoft SQL Server tables. What should you use to configure the connection'

Options:

A.

import that uses a Microsoft account

B.

DirectQuery that uses the end-user s credentials

C.

DirectQuery that uses a database credential

D.

Import that uses a database credential

Buy Now
Questions 9

You need to address the data concerns before creating the data model. What should you do in Power Query Editor?

Options:

A.

Select Column distribution.

B.

Select the sales_amount column and apply a number filter.

C.

Select Column profile, and then select the sales_amount column.

D.

Transform the sales_amount column to replace negative values with 0.

Buy Now
Questions 10

You need to create a relationship between the Weekly_Returns table and the Date table to meet the reporting requirements of the regional managers. What should you do?

Options:

A.

In the Weekly.Returns table, create a new calculated column named date-id in a format of yyyymmdd and use the calculated column to create a relationship to the Date table.

B.

Add the Weekly_Returns data to the Sales table by using related DAX functions.

C.

Create a new table based on the Date table where date-id is unique, and then create a many-to-many relationship to Weekly_Return.

Buy Now
Questions 11

You need to create a measure that will return the percentage of late orders.

How should you complete the DAX expression? To answer, select the appropriate options in the answer area.

NOTE: Each correct selection is worth one point.

PL-300 Question 11

Options:

Buy Now
Questions 12

What should you create to meet the reporting requirements of the sales department?

Options:

A.

a measure that uses a formula of SUM (Sales [sales_id])

B.

a calculated column that use a formula of COUNTA(sales [sales_id])

C.

a measure that uses a formula of COUNTROWS (Sales)

D.

a calculated column that uses a formula of SUM (Sales [sales_id])

Buy Now
Questions 13

You need to create the semantic model.

Which storage mode should you use for the tables in the semantic model?

Options:

A.

live connection

B.

Dual

C.

Import

D.

DirectQuery

Buy Now
Questions 14

You need to minimize the size of the semantic model. The solution must meet the report requirements.

What should you do?

Options:

A.

Filter out discontinued products while importing the Products table.

B.

Group the Categories table by the CategorylD column.

C.

Change the OrderlD column in the Orders table to the Text data type.

D.

Remove the QuantityPerUnit column from the Products table.

Buy Now
Questions 15

You merge data from Sales.Region, Region_Manager, Sales_Manager, and Manager into a single table named Region. What should you do next to meet the reporting requirements of the executives?

Options:

A.

Apply row-level security (RLS) to the Region table based on the sales manager username.

B.

Configure a bi-directional relationship between Region and Sales.Region.

C.

Create a DAX calculated column that retrieves the region manager from the Weekly.Returns table based on the sales.regionjd column.

D.

In the Region table, create a hierarchy that has the manager name, and then the sales manager name.

Buy Now
Questions 16

You need to design the data model and the relationships for the Customer Details worksheet and the Orders table by using Power BI. The solution must meet the report requirements.

For each of the following statement, select Yes if the statement is true, Otherwise, select No.

NOTE: Each correct selection is worth one point.

PL-300 Question 16

Options:

Buy Now
Questions 17

You need to create the required relationship for the executive's visual. What should you do before you can create the relationship?

Options:

A.

Change the data type of Sales[region_id] to Whole Number.

B.

In the Sales table, add a measure for sum(sales_amount).

C.

Change the data type of sales[sales_id] to Text.

D.

Change the data type of sales [region_id] to Decimal Number.

Buy Now
Questions 18

You need to create the Top Customers report.

Which type of filter should you use, and at which level should you apply the filter? To answer, select the appropriate options in the answer area.

NOTE: Each correct selection is worth one point.

PL-300 Question 18

Options:

Buy Now
Questions 19

You use Power Query to import two tables named Order Header and Order Details from an Azure SQL database. The Order Header table relates to the Order Details table by using a column named Order ID in each table.

You need to combine the tables into a single query that contains the unique columns of each table.

What should you select in Power Query Editor?

Options:

A.

Merge queries

B.

Append queries

C.

Combine files

Buy Now
Questions 20

You need to create a relationship in the dataset for RLS.

What should you do? To answer, select the appropriate options in the answer area.

NOTE: Each correct selection is worth one point.

PL-300 Question 20

Options:

Buy Now
Questions 21

You need to design the data model to meet the report requirements.

What should you do in Power BI Desktop?

Options:

A.

From Power Query, use a DAX expression to add columns to the Orders table to calculate the calendar quarter of the OrderDate column, the calendar month of the OrderDate column, the calendar quarter of the ShippedDate column, and the calendar month of the ShippedDate column.

B.

From Power Query, add columns to the Orders table to calculate the calendar quarter and the calendar month of the OrderDate column.

C.

From Power Bl Desktop, use the Auto date/time option when creating the reports.

D.

From Power Query, add a date table. Create an active relationship to the OrderDate column in the Orders table and an inactive relationship to the ShippedDate column in the Orders table.

Buy Now
Questions 22

You need to create the dataset. Which dataset mode should you use?

Options:

A.

DirectQuery

B.

Import

C.

Live connection

D.

Composite

Buy Now
Questions 23

You attempt to connect Power BI Desktop to a Cassandra database.

From the Get Data connector list, you discover that there is no specific connector for the Cassandra database.

You need to select an alternate data connector that will connect to the database.

Which type of connector should you choose?

Options:

A.

Microsoft SQL Server database

B.

ODBC

C.

OLE DB

D.

OData

Buy Now
Questions 24

You have a Power BI dashboard that displays different visualizations of company sales.

You enable Q&A on the dashboard.

You need to provide users with sample questions that they can ask when using Q&A.

Which settings should you modify from the Power BI Settings?

Options:

A.

Subscriptions

B.

Dashboards

C.

Datasets

D.

Workbooks

Buy Now
Questions 25

You need to create a solution to meet the notification requirements of the warehouse shipping department.

What should you do? To answer, select the appropriate options in the answer area.

NOTE: Each correct select is worth one point:

PL-300 Question 25

Options:

Buy Now
Questions 26

You have a Microsoft SharePoint Online site that contains several document libraries.

One of the document libraries contains manufactunng reports saved as Microsoft Excel files. All the manufacturing reports have the same data structure.

You need to use Power Bl Desktop to load only the manufacturing reports to a table for analysis.

What should you do?

Options:

A.

Get data from a SharePoint folder, enter the site URL and then select Combine & Load

B.

Get data from a SharePoint list and enter the site URL Select Combine & Transform, then filter by the folder path to the manufacturing reports library.

C.

Get data from a SharePoint list enter the site URL and then select Combine & Load

D.

Get data from a SharePoint folder and enter the site URL. Select Transform, then filter by the folder path to the manufacturing reports library,

Buy Now
Questions 27

Adding an index key and normalizing casing in the data source would help resolve issues with undefined values and errors in a case-sensitive column. The index key can provide a unique identifier, and normalizing casing ensures consistency in the data, which would likely prevent the errors you encountered in the Power BI semantic model.

You have a Power BI data model that imports a date table and a sales table from an Azure SQL database data source. The sales table has the following date foreign keys.

•Due Date

•Order Date

•Delivery Date

You need to support the analysis of sales over time based on all three dates at the same time.

Solution: For each date foreign key, you add inactive relationships between the sales table and the date table.

Does this meet the goal?

Options:

A.

Yes

B.

No

Buy Now
Questions 28

You have a Microsoft Power Bl dashboard.

You need to ensure that consumers of the dashboard can give you feedback that will be visible to the other consumers of the dashboard.

What should you use?

Options:

A.

Feedback

B.

Subscribe

C.

Comments

D.

Mark as favorite

Buy Now
Questions 29

You use Power Query Editor to preview the data shown in the following exhibit.

PL-300 Question 29

PL-300 Question 29

Options:

Buy Now
Questions 30

You have a query named All Sales that imports sales data into a Power BI model.

You plan to create a star schema by separating columns into separate queries and performing further transformations. The solution must meet the following requirements:

• Use All Sales as the source for three other queries named Sales Fact Product Dimension, and Customer Dimension.

• Minimize maintenance effort.

What should you do to create the Sales Fact query, and for which query should you clear Enable load? To answer, select the appropriate options in the answer area.

NOTE: Each correct selection is worth one point.

PL-300 Question 30

Options:

Buy Now
Questions 31

You have the Performance analyzer results shown in the following exhibit.

PL-300 Question 31

PL-300 Question 31

Options:

Buy Now
Questions 32

You are using Microsoft Power Bl Desktop to profile data in Power Query Editor. Table data is displayed as shown in the following exhibit.

PL-300 Question 32

Use the drop-down menus to select the answer choice that completes each statement based on the information presented in the graphic.

NOTE: Each correct selection is worth one point.

PL-300 Question 32

Options:

Buy Now
Questions 33

You have a Power Bi report for the procurement department. The report contains data from the following tables.

PL-300 Question 33

There is a one-to-many relationship from Suppliers to Lineitems that uses the ID and Supplier ID columns. The report contains the visuals shown in the following table.

PL-300 Question 33

You need to minimize the size of the dataset without affecting the visuals. What should you do?

Options:

A.

Remove the rows from Lineitems where LineItems[invoice Date] is before the beginning of last month

B.

Merge Suppliers and Uneltems.

C.

Group Lineltems by Lineitems[ invoice id) and Lineitems[invoice Date) with a sum of Lineitems(price).

D.

Remove the Lineitems[Description] column.

Buy Now
Questions 34

You have a query named Customer that imports CSV files from a data lake. The query contains 500 rows as shown in the exhibit. (Click the Exhibit tab.)

PL-300 Question 34

Each file contains deltas of any new or modified rows from each load to the data lake. Multiple files can have the same customer ID.

You need to keep only the last modified row for each customer ID.

Which three actions should you perform in sequence? To answer, move the appropriate actions from the list of actions to the answer area and arrange them in the correct order.

PL-300 Question 34

Options:

Buy Now
Questions 35

You have a Microsoft Power Bl report. The size of PBIX file is 550 MB. The report is accessed by using an App workspace in shared capacity of powerbi.com.

The report uses an imported dataset that contains one fact table. The fact table contains 12 million rows. The dataset is scheduled to refresh twice a day at 08:00 and 17:00.

The report is a single page that contains 15 custom visuals and 10 default visuals.

Users say that the report is slow to load the visuals when they access and interact with the report

You need to recommend a solution to improve the performance of the report.

What should you recommend?

Options:

A.

Split the visuals onto multiple pages.

B.

Implement row-level security (RLS).

C.

Replace the default visuals with custom visuals.

D.

Increase the number of times that the dataset is refreshed.

Buy Now
Questions 36

PL-300 Question 36

Each Region value appears only on the tow where it first occurred. Each subsequent occurrence of the Region value is blank.

You need to ensure that every row contains the connect non-blank value The solution must minimize development effort.

Which column should you select, and which action should you perform on the column? To answer, select the appropriate options in the answer area. NOTE; Each connect selection is worth one point.

PL-300 Question 36

Options:

Buy Now
Questions 37

You maintain a Power Bl workspace that contains a supplier quality dashboard. The dashboard contains 10 card visuals, two map visuals and five bar chart visuals.

The dashboard mobile layout is shown in the exhibit. (Click the Exhibit tab.)

PL-300 Question 37

You need to modify the dashboard mobile layout to meet the following requirements:

• Only show single-value visuals.

• Minimize scrolling.

What should you do?

Options:

A.

Remove the card visual, increase the size of the map and bar chart visuals

B.

Decrease the size of the map and bar chart visuals Move all the card visuals to the top of the layout.

C.

Move the bar chart visuals to the top of the layout Remove the map visuals. Decrease the size of the card visuals.

D.

Decrease the size of the card visuals. Remove the map and bar chart visuals.

Buy Now
Questions 38

You publish a dataset that contains data from an on-premises Microsoft SQL Server database.

The dataset must be refreshed daily.

You need to ensure that the Power BI service can connect to the database and refresh the dataset.

Which four actions should you perform in sequence? To answer, move the appropriate actions from the list of actions to the answer area and arrange them in the correct

PL-300 Question 38

Options:

Buy Now
Questions 39

You have a Power BI app named App1. The privacy for the App1 workspace is set to Private.

A user named User1 reports that App1 does not appear in the My organization AppSource. App1 appears in the My organization AppSource for your account.

You need to ensure that User sees App1 from the My organization AppSource.

What should you do?

Options:

A.

From the app workspace, click Update app, configure the Content settings, and then click Update app.

B.

From the app workspace settings, add a member.

C.

From the app workspace, click Update app, configure the Access setting, and then click Update app.

D.

From the app workspace, share the dashboard.

Buy Now
Questions 40

You have a Power Bl semantic model that contains two queries.

You discover that a report based on the model has performance issues.

You plan to use Power Query to reduce the data loaded to the model.

Which two actions should you perform? Each correct answer presents part of the solution.

NOTE: Each correct answer is worth one point.

Options:

A.

Apply group by and summarize techniques.

B.

Combine the queries by using Append.

C.

Remove unnecessary columns and rows.

D.

Combine the queries by using Merge.

E.

Create a new query group.

Buy Now
Questions 41

Note: This question is part of a series of questions that present the same scenario. Each question in the series contains a unique solution that might meet the stated goals. Some question sets might have more than one correct solution, while others might not have a correct solution.

After you answer a question in this scenario, you will NOT be able to return to it. As a result, these questions will not appear in the review screen.

You have a clustered bar chart that contains a measure named Salary as the value and a field named Employee as the axis. Salary is present in the data as numerical amount representing US dollars.

You need to create a reference line to show which employees are above the median salary.

Solution: You create a percentile line by using the Salary measure and set the percentile to 50%.

Does this meet the goal?

Options:

A.

Yes

B.

No

Buy Now
Questions 42

You have a line chart that shows the number of employees in a department over time.

You need to see the total salary costs of the employees when you hover over a data point.

What is possible way to achieve this goal?

Options:

A.

Add a salary to the tooltips.

B.

Add a salary to the visual filters.

C.

Add salary to the drillthrough fields.

Buy Now
Questions 43

You need to create a semantic model in Power 81 Desktop. The solution must meet the following requirements:

• The model must contain a table named Orders that has one row per order. Each row will contain the total amount per order.

• The orders must be filtered to the selected CustomerlD value.

• Users must select the CustomerlD value from a list.

• The list of customers must come from an OData source.

Which three objects should you create in Power Query Editor? Each correct answer presents part of the solution.

NOTE: Each correct selection is worth one point.

Options:

A.

an Orders query that has a single column containing a list of customers

B.

a parameter for CustomerlD that uses a query to populate the suggested values

C.

an Orders query that has a filter on CustomerlD

D.

a Customers query that has a single column containing a list of customer IDs

E.

a Customers query that has a filter on CustomerlD

F.

a parameter for CustomerlD that uses manually entered values to populate the suggested values

Buy Now
Questions 44

You are creating a new semantic model in Microsoft Power Bl Desktop.

You connect to a recently used data source and receive an error message indicating that the password is expired.

You need to update the credentials for the data source.

What should you do?

Options:

A.

From the Modeling tab, select Manage Roles, and then add a role.

B.

From Options, select Data Load, and then select Clear Cache.

C.

From Power Query Editor, select Refresh Preview

D.

From Data Source settings, select the data source, and then select Edit Permissions.

Buy Now
Questions 45

You need to create the On-Time Shipping report. The report must include a visualization that shows the percentage of late orders.

Which type of visualization should you create?

Options:

A.

bar chart

B.

scatterplot

C.

pie chart

Buy Now
Questions 46

What should you do to address the existing environment data concerns?

Options:

A.

a calculated column that uses the following formula: ABS(Sales[sales_amount])

B.

a measure that uses the following formula: SUMX(FILTER('Sales', 'Sales'[sales_amount] > 0)),[sales_amount])

C.

a measure that uses the following formula: SUM(Sales[sales_amount])

D.

a calculated column that uses the following formula: IF(ISBLANK(Sales[sales_amount]),0, (Sales[sales_amount]))

Buy Now
Questions 47

You plan to create a report that will display sales data from the last year for multiple regions

You need to restrict access to individual rows of the data on a per region-basis by using roles.

Which four actions should you perform in sequence? To answer, move the appropriate actions from the list of actions to the answer area and arrange them in the correct order.

PL-300 Question 47

Options:

Buy Now
Questions 48

Note: This question is part of a series of questions that present the same scenario. Each question in the series contains a unique solution that might meet the stated goals. Some question sets might have more than one correct solution, while others might not have a correct solution.

After you answer a question in this section, you will NOT be able to return to it. As a result, these questions will not appear in the review screen.

You have an on-premises data gateway.

You need to reduce the amount of data sent through the gateway by semantic models that run in Import storage mode.

Solution: You create aggregations to summarize results.

Does this meet the goal?

Options:

A.

Yes

B.

No

Buy Now
Questions 49

Your company has employees in 10 states.

The company recently decided to associate each state to one of the following three regions: East, West, and North.

You have a data model that contains employee information by state. The model does NOT include region

information.

You have a report that shows the employees by state.

You need to view the employees by region as quickly as possible.

What should you do?

Options:

A.

Create a new aggregation that summarizes by employee.

B.

Create a new group on the state column and set the Group type to List.

C.

Create a new group on the state column and set the Group type to Bin.

D.

Create a new aggregation that summarizes by state.

Buy Now
Questions 50

You have the visual shown in the exhibit. (Click the Exhibit tab.)

PL-300 Question 50

You need to show the relationship between Total Cost and Total Sales over time.

What should you do?

Options:

A.

Add a play axis.

B.

Add a slicer for the year.

C.

From the Analytics pane, add an Average line.

D.

Create a DAX measure that calculates year-over-year growth.

Buy Now
Questions 51

You have a Power Bl workspace that contains several reports.

You need to provide a user with the ability to create a dashboard that will use the visuals from the reports.

What should you do?

Options:

A.

Grant the Read permission for the datasets to the user.

B.

Add the user as a Viewer of the workspace.

C.

Share the reports with the user.

D.

Create a row-level security (RLS) role and add the user to the role.

E.

Add the user as a member of the workspace.

Buy Now
Questions 52

You publish a report to a workspace named Customer Services. The report identifies customers that have potential data quality issues that must be investigated by the customer services department of your company.

You need to ensure that customer service managers can create task lists in Microsoft Excel based on the data.

Which report setting should you configure?

Options:

A.

Don't allow end user to save filters on this report.

B.

Change default visual interaction from cross highlighting to cross filtering.

C.

Enable the updated filter pane, and show filters in the visual header for this report.

D.

Allow users to add comments to this report.

E.

Choose the type of data you allow your end users to export.

Buy Now
Questions 53

You need to use Power B1 to create a visual that will allow users to compare the sales performance of five sales regions for the current month.

Which visual should you use?

Options:

A.

a stacked bar chart

B.

a 100% stacked bar chart

C.

a waterfall chart

D.

a line chart

Buy Now
Questions 54

Note: This question is part of a series of questions that present the same scenario. Each question in the series contains a unique solution that might meet the stated goals. Some question sets might have more than one correct solution, while others might not have a correct solution.

After you answer a question in this section, you will NOT be able to return to it. As a result, these questions will not appear in the review screen.

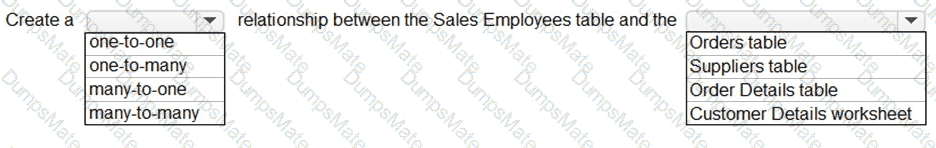
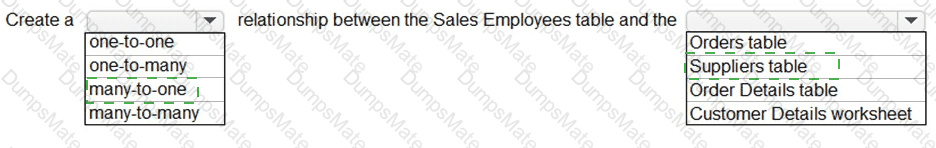
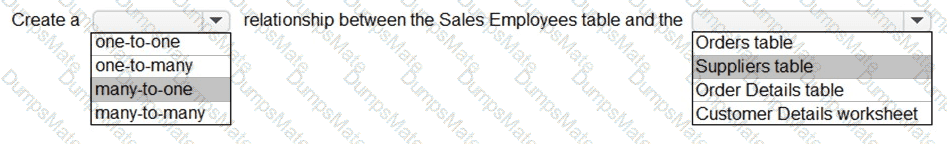
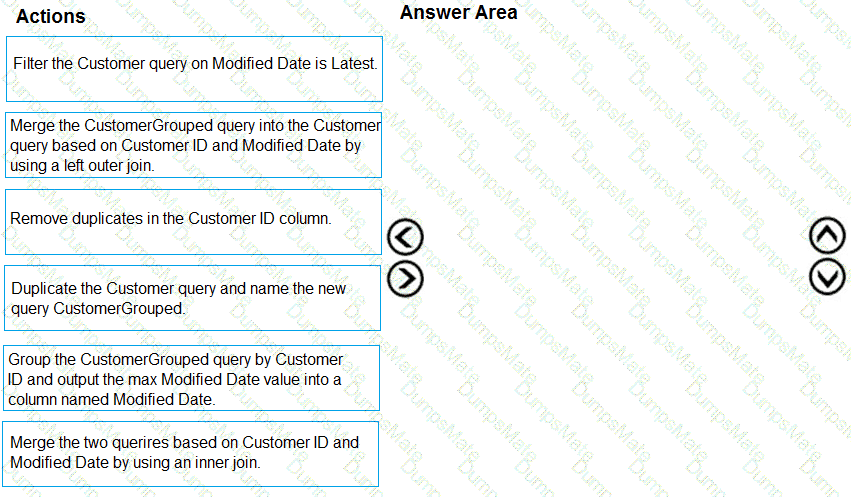
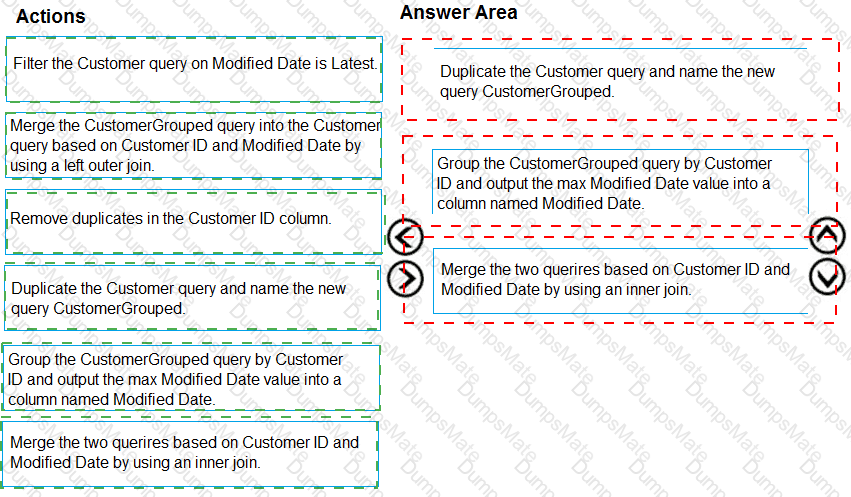
You have a Power BI model that contains two tables named Sales and Date. Sales contains four columns named TotalCost, DueDate, ShipDate, and OrderDate. Date contains one column named Date.

The tables have the following relationships:

    Sales[DueDate] and Date[Date]

    Sales[ShipDate] and Date[Date]

    Sales[OrderDate] and Date[Date]

The active relationship is on Sales[DueDate].

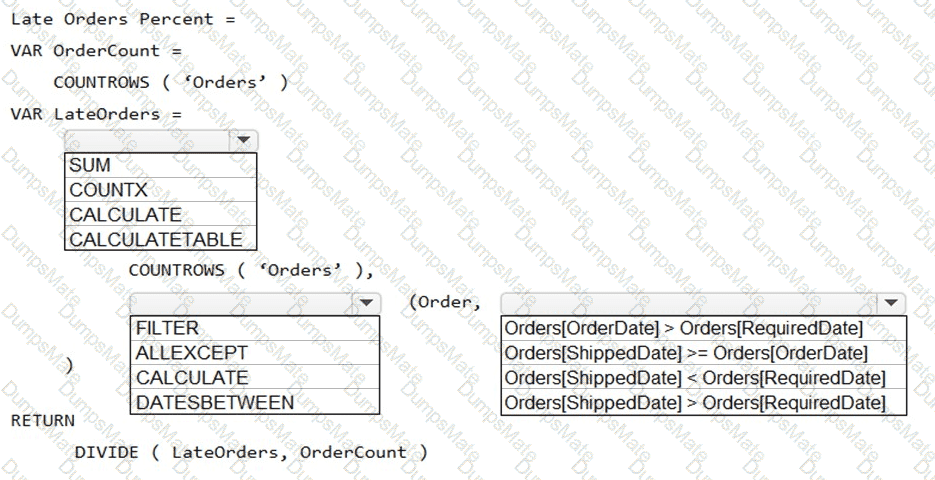
You need to create measures to count the number of orders by [ShipDate] and the orders by [OrderDate]. You must meet the goal without duplicating data or loading additional data.

Solution: You create measures that use the CALCULATE, COUNT, and USERELATIONSHIP DAX functions.

Does this meet the goal?

Options:

A.

Yes

B.

No

Buy Now
Questions 55

Your company plans to use Power BI for 20 users in the sales department. The users will perform the following tasks:

    Access a published Power BI app

    Modify reports in an app workspace

    Share dashboards created in My Workspace

You need to identify which Power BI licenses are required for the tasks. The solution must use the Power BI (free) licenses, whenever possible.

Which license should you identify for each task? To answer, select the appropriate options in the answer area.

NOTE: Each correct selection is worth one point.

PL-300 Question 55

Options:

Buy Now
Questions 56

Your company plans to completely separate development and production assets such as datasets, reports, and dashboards in Microsoft Power BI.

You need to recommend an application lifecycle strategy. The solution must minimize access to production assets and prevent end users from viewing the development assets.

What should you recommend?

Options:

A.

Create production reports in a separate workspace that uses a shared dataset from the developmentworkspace. Grant the end users access to the production workspace.

B.

Create one workspace for development. From the new workspace, publish an app for production.

C.

Create a workspace for development and a workspace for production. From the production workspace,publish an app.

D.

In one workspace, create separate copies of the assets and append DEV to the names of the copied assets. Grant the end users access to the workspace.

Buy Now
Questions 57

You need to create a relationship in the dataset for RLS.

What should you do? To answer select the appropriate options in the answer area.

NOTE: Each correct selection is worth one point.

PL-300 Question 57

Options:

Buy Now
Questions 58

You build a report to help the sales team understand its performance and the drivers of sales. The team needs to have a single visualization to identify which factors affect success. Which type of visualization should you use?

Options:

A.

Key influences

B.

Funnel chart

C.

Q&A

D.

Line and clustered column chart

Buy Now
Questions 59

You are creating reports in Power BI Desktop. The model has the following tables.

PL-300 Question 59

There is a relationship between the tables.

You plan to publish a report to the Power BI service that displays Order_amount by Order_date by Full_name.

You need to ensure that only the columns required for the report appear in Report View. The solution must minimize the size of the dataset that is published.

How should you configure the columns in Power BI Desktop? To answer, select the appropriate options in the answer area.

NOTE: Each correct selection is worth one point.

PL-300 Question 59

Options:

Buy Now
Questions 60

You need to create a visualization to meet the reporting requirements of the sales managers.

How should you create the visualization? To answer, select the appropriate options in the answer area.

NOTE: Each correct selection is worth one point.

PL-300 Question 60

Options:

Buy Now
Questions 61

You need to create a calculated column to display the month based on the reporting requirements. Which DAX expression should you use?

Options:

A.

FORMAT('Date'[date], "MMM YYYY")

B.

FORMAT('Date' [date], "M YY")

C.

FORMAT('Date'[date_id], "MMM") & "" & FORMAT('Date'[year], "#")

D.

FORMAT('Date' [date_id], "MMM YYYY")

Buy Now
Questions 62

You need to ensure that the data is updated to meet the report requirements. The solution must minimize configuration effort.

What should you do?

Options:

A.

From each report in powerbi.com. select Refresh visuals

B.

From Power Bl Desktop, download the PBIX file and refresh the data.

C.

Configure a scheduled refresh without using an on-premises data gateway.

D.

Configure a scheduled refresh by using an on-premises data gateway

Buy Now
Questions 63

You need to grant access to the business unit analysts.

What should you configure? To answer, select the appropriate options in the answer area.

NOTE: Each correct selection is worth one point.

PL-300 Question 63

Options:

Buy Now
Questions 64

You need to calculate the last day of the month in the balance sheet data to ensure that you can relate the balance sheet data to the Date table. Which type of calculation and which formula should you use? To answer, select the appropriate options in the answer area. NOTE: Each correct selection is worth one point.

PL-300 Question 64

Options:

Buy Now
Questions 65

You need to create a DAX measure in the data model that only allows users to see projections at the appropriate levels of granularity.

How should you complete the measure? To answer, drag the appropriate values to the correct targets. Each value may be used once, more than once, or not at all. You may need to drag the split bar between panes or scroll to view content.

NOTE: Each correct selection is worth one point.

PL-300 Question 65

Options:

Buy Now
Questions 66

You need to create the relationship between the product list and the revenue results. The solution must minimize the time it takes to render visuals.

What should you set as the relationship cardinality?

Options:

A.

One to one

B.

Many to one

C.

One to many

D.

Many to many

Buy Now
Questions 67

What is the minimum number of datasets and storage modes required to support the reports?

Options:

A.

two imported datasets

B.

a single DirectQuery dataset

C.

two DirectQuery datasets

D.

a single imported dataset

Buy Now
Questions 68

Once the profit and loss dataset is created, which four actions should you perform in sequence to ensure that the business unit analysts see the appropriate profit and loss data? To answer, move the appropriate actions from the list of actions to the answer area and arrange them in the correct order.

PL-300 Question 68

Options:

Buy Now
Questions 69

You need to recommend a strategy to consistently define the business unit, department, and product category data and make the data usable across reports.

What should you recommend?

Options:

A.

Create a shared dataset for each standardized entity.

B.

Create dataflows for the standardized data and make the dataflows available for use in all imported datasets.

C.

For every report, create and use a single shared dataset that contains the standardized data.

D.

For the three entities, create exports of the data from the Power Bl model to Excel and store the data in Microsoft OneDrive for others to use as a source.

Buy Now
Questions 70

Which DAX expression should you use to get the ending balances in the balance sheet reports?

Options:

A.

CALCULATE (SUM( BalanceSheet [BalanceAmount] ),DATESQTD( 'Date'[Date] ))

B.

CALCULATE (SUM( BalanceSheet [BalanceAmount] ),LASTDATE( 'Date'[Date] ))

C.

FIRSTNONBLANK ( 'Date' [Date]SUM( BalanceSheet[BalanceAmount] ))

D.

CALCULATE (MAX( BalanceSheet[BalanceAmount] ),LASTDATE( 'Date' [Date] ))

Buy Now
Exam Code: PL-300
Exam Name: Microsoft Power BI Data Analyst
Last Update: Nov 20, 2025
Questions: 464

PDF + Testing Engine

$61.25  $174.99

Testing Engine

$47.25  $134.99
buy now PL-300 testing engine

PDF (Q&A)

$40.25  $114.99
buy now PL-300 pdf
dumpsmate guaranteed to pass
24/7 Customer Support

DumpsMate's team of experts is always available to respond your queries on exam preparation. Get professional answers on any topic of the certification syllabus. Our experts will thoroughly satisfy you.

Site Secure

mcafee secure

TESTED 20 Nov 2025