Weekend Sale - 70% Discount Offer - Ends in 0d 00h 00m 00s - Coupon code: dm70dm

TDA-C01 Tableau Certified Data Analyst Exam Questions and Answers

Questions 4

You publish a dashboard tut uses an attract. The extract refreshes every Monday at 10:00.

You need to ensure that the extract also refreshes on the last day of the month at 18:00.

What should you do?

Options:

A.

From Tableau Desktop, open the Publish Workbook dialog box and configure the schedule.

B.

From Tableau Server select the workbook select Refresh Extracts and then add a new extract refresh

C.

From Tableau Server. select Schedules find the schedule of the extract, and change the frequency to the Last day of the month

D.

From Tableau Server. select Schedules and change the priority of the existing schedule

Buy Now
Questions 5

You have a dashboard that contains confidential information about patients health. The data needs to always be up to date tor a team of healthcare workers How should you share me dashboard with the healthcare workers?

Options:

A.

Publish the dashboard to Tableau Public

B.

Print the dashboard to PDF

C.

Publish the dashboard to Tableau Server

D.

Export the dashboard as a .twbx

Buy Now
Questions 6

A colleague provides you with access to a folder that contains the following files:

• Sates.csv

• Bookl.twb

• Sates.hyper

• Export.mdb

Which He contains an extract?

Options:

A.

Export mdb

B.

Book1.twb

C.

Sales.hyper

D.

Sales.csv

Buy Now
Questions 7

You have the following tiled dashboard that has one sheet.

You want to replace the sheet with Sheet2.

What should you do?

Options:

A.

Right-click Sheet2 and select Add to Dashboard.

B.

Select Sheet3 and click the Swap Sheet button next to Sheet2.

C.

From the context menu of Sheet3. select Remove Dashboard item

D.

Drag Sheet2 to the dashboard.

E.

From the context menu of Sheet3. select Deselect

Buy Now
Questions 8

You have the following line chart that shows the average sales by month.

TDA-C01 Question 8

Which month had the biggest increase in swage sales compared to me previous month in 2019?

Options:

A.

August

B.

October

C.

December

D.

November

Buy Now
Questions 9

You have the following box plot that shows the distribution of average profits made in every state by region.

TDA-C01 Question 9

Which region has the smallest distribution of profits?

Options:

A.

South

B.

Cast

C.

Central

D.

West

Buy Now
Questions 10

You are the owner of an alert.

You receive an email notification that the alert was suspended

From where can you resume the suspended alert?

Options:

A.

The Data Source page of Tableau Desktop

B.

The Notification area of Tableau Prep

C.

The My Content area of Tableau web pages

D.

The Shared with Ma page

Buy Now
Questions 11

You have a line chart on a worksheet.

You want to add a comment to March 2020 as shown in the following visualization.

What should you do?

Options:

A.

Drag the growth rate to Text on the Marks card

B.

Enable captions

C.

Annotate March 2020

D.

Add a tooltip

Buy Now
Questions 12

You plan to create a visualization that has a dual axis chart. The dual axis chart will contain a shape chart and a line chart will use the same measure named Population on the axis.

You need to configure be shapes to be much larger than the line.

What should you do?

Options:

A.

Duplicate Population Drag the duplicate to the second Marks card and configure the see of the marks independently

B.

Create a custom shape that is larger than the default shape and add the shape to the Shapes folder in My Repository

C.

For the second axis select Shape on the Marks card From Select Shape Palette select Custom and then select Reset

D.

Change Population to a discrete dimension

Buy Now
Questions 13

You want to connect a Tableau workbook to a dataset in a Microsoft Excel spreadsheet.

What should you do from Tableau Desktop?

Options:

A.

From the Data menu select New Data Source

B.

From the Data menu select Replace Data Source

C.

From the File menu select Import Workbook

D.

From the File menu select New

Buy Now
Questions 14

You have the following dataset.

Which Level of Detail (LOD) expression should you use to calculate tie grand total of all the regions?

Options:

A.

{FIXED: [Region] SUM Sales}

B.

{FIXED: SUM Sales}

C.

{Fixed: [Region]: TOTAL Sales}

D.

{FIXED: TOTAL (Sales)}

Buy Now
Questions 15

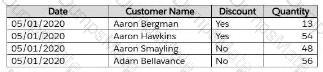
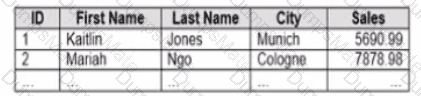
You company has two divisions located in the United States and Germany Bach division has a separate database. The following is a sample of the sales data for the division in the United States.

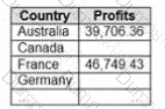
The following is a sample of the sales data for me division in Germany.

TDA-C01 Question 15

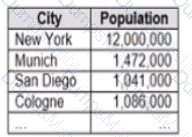
You have population data in a file named Populatio.csv. the following is a sample of the data.

TDA-C01 Question 15

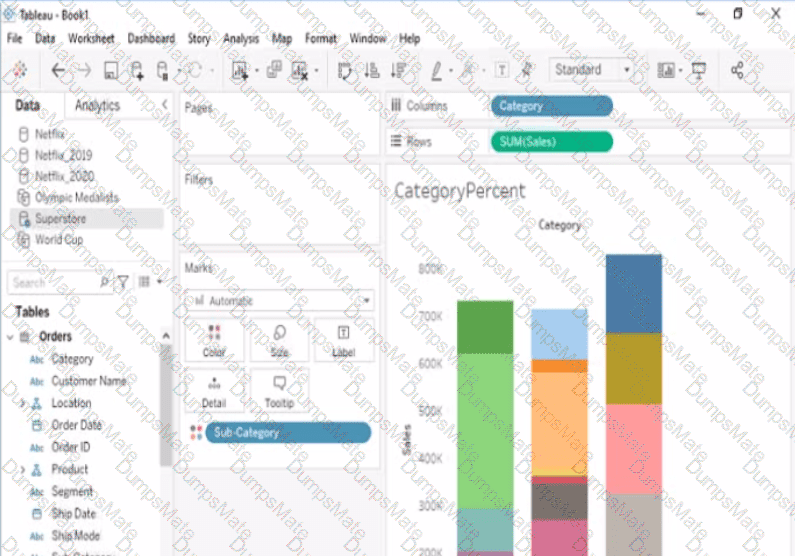
You plan to create a visualization that ml show tie sales per capita for each salesperson Each salesperson must be identified by identified by their full name.

You need to prepare the data to support the planned visualization. The data source must support being published .

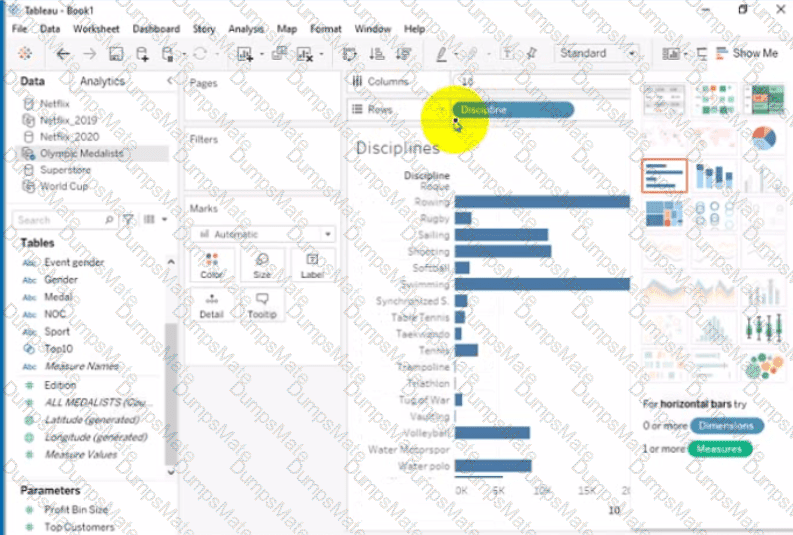
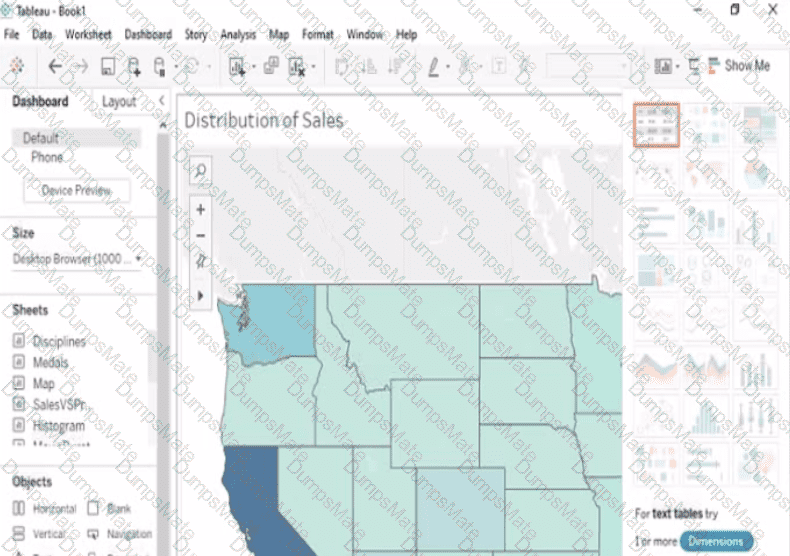
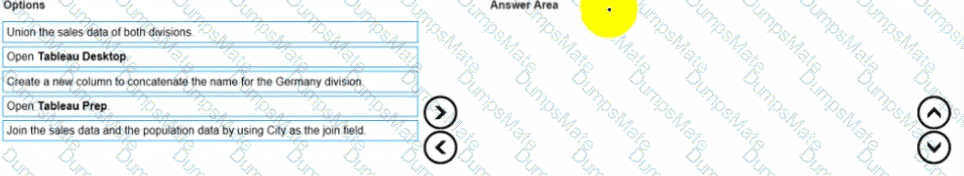
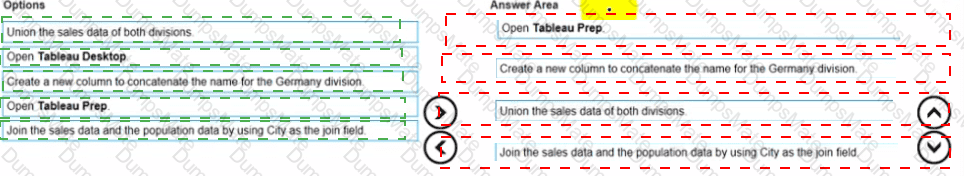
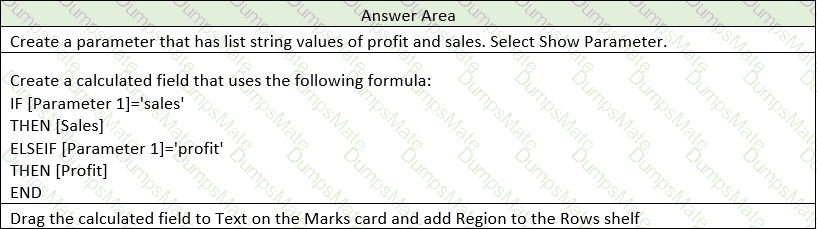
Which four actions should you perform in order?

(Place the four correct options n order Use the arrows to move Options to Answer Area arrows to re-order the options.

Use Answer Area arrows to re-order the options)

TDA-C01 Question 15

Options:

Buy Now
Questions 16

You have the following dashboard.

TDA-C01 Question 16

When a user selects a only on the map the data on the bar chart must show only the data for the selected city. The data in the bar chart must change only when the user selects a different city How should you configure the dashboard action? (Use the dropdowns in the Answers Area to select the correct options.)

Options:

Buy Now
Questions 17

You have the following dataset.

You need to create the following worksheet.

The table must show either profit or sales based on the selection from the Parameter 1 menu.

Which three actions should you perform in orders

(Place the three correct options in order Use the arrows to move Options lo Answer Area Use Answer Area arrows to reorder the options)

Options:

Buy Now
Questions 18

You have the following dataset.

TDA-C01 Question 18

Yon need to calculate the ranking shown in the Rank field.

How should you complete the formula? (Use the dropdowns in the Answer Area to select the correct options to complete the formula ?

TDA-C01 Question 18

Options:

Buy Now
Questions 19

In a worksheet, you have a calculated column named YTD Sales that uses the following formula.

[Order Date] <= TODAY () AND DATETBUNC {“year”, [Order Dace]) = DATETPUNC)"year", TODAY(J)

You want to create a calculated column named Exclude Current Month that will be dragged to the Filters shell. Exclude Current Month will exclude the current month values from YTD Sales.

How should you complete the formula for Exclude Current Month? (Drag the appropriate Options to the Answer Area and drop into the correct locations.)

TDA-C01 Question 19

Options:

Buy Now
Questions 20

A Data Analyst has received a request to provide a dashboard related to employee time logs. The employees are entering their time using mobile devices throughout the day and data is stored in a cloud-based database. The end users would like to receive data on their dashboard in as close to real-time as possible.

How should the analyst best create a data source to meet these requirements?

Options:

A.

Create a connection to the database using Tableau Desktop. Publish the data source to Tableau Cloud using a live connection and disable any firewalls on the database.

B.

Create a connection to the database to retrieve the data using Tableau Bridge. Schedule the refresh of the data extract to 15 minutes.

C.

Create a connection to the database using Tableau Desktop. Publish the data source to Tableau Cloud using a live connection, ensuring the database firewall has been configured to allow connections from Tableau Cloud.

D.

Create a connection to the database using Tableau Desktop and retrieve an extract of the data. Publish the data source from Tableau Desktop to Tableau Cloud and schedule the refresh of the extract.

Buy Now
Questions 21

How should a Data Analyst sort data by Sales across multiple dimensions in Tableau?

Options:

A.

Use the Sets feature to combine dimensions and then sort one of the fields.

B.

Use the Group feature to combine dimensions and then sort the grouped field.

C.

Right-click on the rightmost dimension, choose Sort, then select nested in the options.

D.

Right-click on each dimension, choose Sort, then select data source order in the options.

Buy Now
Questions 22

A Data Analyst creates a parameter named Choose Region that contains values from a field named Region.

The analyst wants users to be able to use the Choose Region parameter to interact with a chart by toggling between different regions.

What should the analyst do next?

Options:

A.

Add Region to the Filters card.

B.

Add the Choose Region parameter to the Pages card.

C.

Set the Choose Region parameter to Single Value (list).

D.

Add the [Region] = [Choose Region] formula to the Filters card.

Buy Now
Questions 23

You have the following two datasets:

• A Microsoft Excel worksheet that has two columns named Employee Name and Department

• A Microsoft SQL Server table that has three columns named Employee Name. Pay Grade and Team Size.

You want to use Tableau Prep to join the two datasets.

Which three actions should you perform in order? (Place the three correct options in order.)

Options:

Buy Now
Questions 24

A Data Analyst has the following dataset.

TDA-C01 Question 24

The analyst wants to create a parameter to dynamically filter the data to produce the following results based on quantity being above X value.

TDA-C01 Question 24

Which two types of parameters should the analyst use to produce the results? (Choose two)

Options:

A.

Integer

B.

Boolean

C.

Date

D.

Float

Buy Now
Questions 25

You have the following dataset that contain null values in the Profits field.

TDA-C01 Question 25

You want the data to appear as shown in the following table.

Which two formulas achieve the goal? Choose two.

Options:

A.

ZN ([Profits])

B.

ISNULL ([Profits])

C.

IFNULL [(profits] ,0)

D.

IF [Profits] != null then [Profits] END

Buy Now
Questions 26

Open the link to Book1 found on the desktop. Open the CategoryPercentage worksheet.

Modify the bar chart show the percentage of sales for each Subcategory within every Category. The total percentage for every Category must be 100%.

TDA-C01 Question 26

Options:

Buy Now
Questions 27

A Data Analyst has a large data source that contains more than 10 million rows. Users can filter the rows by a field named Animal.

The following is a sample of the data.

TDA-C01 Question 27

The analyst wants to ensure that every calculation is affected by including only animals of a particular type.

Which type of filter should the analyst create on the worksheet?

Options:

A.

Extract

B.

Table calculation

C.

Context

D.

Measure

Buy Now
Questions 28

Open the Link to Book1 found on the desktop. Open Map worksheet and use Superstore data source.

Create a filed map to show the distribution of total Sales by State across the United States.

Options:

Buy Now
Questions 29

Open the link to Book1 found on the desktop. Open the Movie Durations worksheet.

Replace the existing data source with the Netflix_2019 data source.

Options:

Buy Now
Questions 30

Open the link to Book1 found on the desktop. Open the Line worksheet.

Modify the chart to show only main and max values of both measures in each region.

Options:

Buy Now
Questions 31

Open the link to Book1 found on the desktop. Open Disciplines worksheet.

Filter the table to show the Top 10 NOC based on the number of medals won.

Options:

Buy Now
Questions 32

Open the link to Book1 found on the desktop. Open Disciplines worksheet.

Filter the table to show the members of the Top10 set and the members of the Bottom10 set. There should be a total of 20 rows.

TDA-C01 Question 32

Options:

Buy Now
Questions 33

Open the link to Book1 found on the desktop. Use the Superstore data source.

Split the Customer Name field into two fields named First Name and Last Name.

TDA-C01 Question 33

Options:

Buy Now
Questions 34

Open the link to Book1 found on the desktop. Open SalesVSProfit worksheet.

Add a distribution band on Profit to show the standard deviation from- 1 to 1.

Options:

Buy Now
Questions 35

Open the link to Book1 found on the desktop. Open the Histogram worksheet and use the Superstone data source.

Create a histogram on the Quantity field by using bin size of 3.

Options:

Buy Now
Questions 36

Open the link to Book1 found on the desktop. Open the sales dashboard.

Add the Sales by State sheet in a Show/Hide button to the right side of the dashboard.

Options:

Buy Now
Exam Code: TDA-C01
Exam Name: Tableau Certified Data Analyst Exam
Last Update: Jul 31, 2025
Questions: 175

PDF + Testing Engine

$49.5  $164.99

Testing Engine

$37.5  $124.99
buy now TDA-C01 testing engine

PDF (Q&A)

$31.5  $104.99
buy now TDA-C01 pdf
dumpsmate guaranteed to pass
24/7 Customer Support

DumpsMate's team of experts is always available to respond your queries on exam preparation. Get professional answers on any topic of the certification syllabus. Our experts will thoroughly satisfy you.

Site Secure

mcafee secure

TESTED 02 Aug 2025